
Dashboard tour · menu
Dashboard
Dashboard tour
The Arbr console is where you watch spend, approve routing changes, and set the guardrails. This is a tour of the observability pages. Setting up routing, running evals, and governance each have their own guide.
Finding your way around
The left sidebar groups every page by what it's for, following the same five stages the product is built around:
| Group | Pages | For |
|---|---|---|
| Connect | Models, Settings | Wire providers and applications up to the gateway. |
| See | Overview, Applications | Know what you're spending, and where. |
| Recommend | Recommendations | Where a cheaper model would fit. |
| Route | Routing, Model Evals | Send each request to the right model, with evidence. |
| Govern | Budgets, Governance, Audit, Users | Limits, guardrails, and records. |
The Users page only appears to administrators. Two pages aren't in the sidebar: Arbr overhead (reached from the Overview tile) and each application's detail page (reached by clicking an application).
The status chips
Every page carries a few chips in the top-right corner, so the system's state is always visible:
- A green live-providers chip listing connected providers, or an amber "Demo" chip when none are connected.
- A red "N budgets over" chip when any cap is breached.
- A routing-mode chip ("AI routing" or "Cost guardrail"), hidden when routing is off.
Overview
The landing page: total AI usage and cost across the organisation. It has three tabs, and the tab is remembered in the URL.
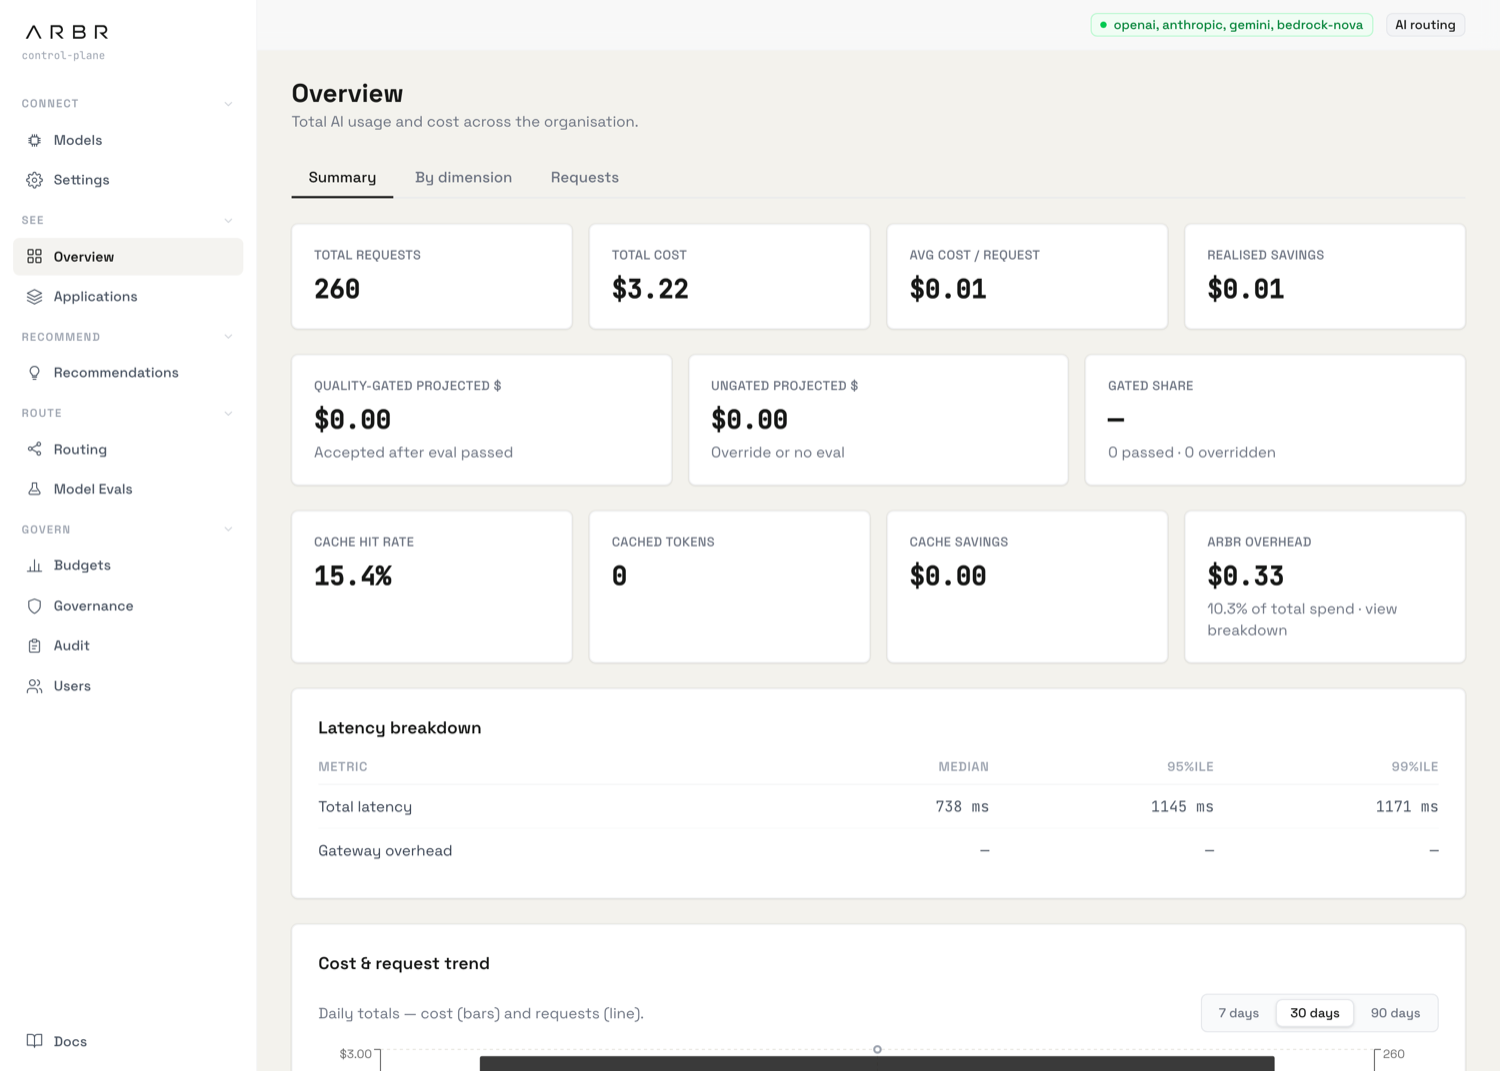
Summary tab
Three rows of stat tiles, then the detail cards:
- Core totals: Total requests, Total cost (with a note if some requests couldn't be priced), Avg cost / request, and Realised savings.
- Savings trust: Quality-gated projected $ (accepted after an eval passed), Ungated projected $ (override or no eval), and Gated share. This is how you tell savings backed by evidence from savings taken on trust.
- Caching and overhead: Cache hit rate, Cached tokens, Cache savings, and Arbr overhead. The overhead tile only appears when Arbr has spent something on itself, and it's a link to the full breakdown.
Below the tiles: a Latency breakdown table (total latency, gateway overhead, and streaming TTFT at the 50th / 95th / 99th percentiles), a Cost & request trend chart, a Realised savings by substitution table (requests that asked for one model but were served a cheaper one, priced at the requested model), and side-by-side Spend by provider and Spend by task type tables.
By dimension tab
The same spend and latency, grouped by whichever dimension you pick: Application, Team, User, Workflow, Model, Provider, or Task type. One button row, one table.
Requests tab
The full request log. It's covered under Requests below, since the same table appears in a few places.
Applications
A per-application view with a health signal on each one. Toggle between a card view and a list view (top-right); your choice is remembered.
Each application shows a coloured health dot: green (healthy), amber (degraded latency or success rate), red (failing or disconnected), or grey (no requests yet). Disconnected and failing applications sort to the top so problems surface first. Each card carries a connected / disconnected toggle that is the application's kill switch. Flip it off and that application's traffic is rejected immediately, without affecting anyone else.
Click an application to open its detail page, which has two tabs:
- Overview shows the same stats and request log, scoped to that one application.
- Routing policy holds an allowed-models picker (deselected models are blocked at the gateway for this app) and a per-application routing policy that can override the global one. See Per-application overrides.
The request log
Every request, with a detail drawer that explains exactly why it routed the way it did. This table appears on the Overview "Requests" tab, on each application's detail page, and on the Arbr overhead page.
Filtering
Across the top: a period selector (Today / 7 days / 30 days / All time), a status filter (Success / Failure / Blocked), and a source filter, where "Routed" means it went through the gateway and "Observed" means it was reported after the fact via POST /v1/ingest. A facet card adds dropdowns for Application, Workflow, Department, Model, Provider, and Task type, plus a search box for a request ID.
Columns
Time, App, Workflow, Task (with a small badge for how it was classified: provided, rule-based, or AI), Served model (showing requested → served when they differ), a coloured Routing badge, Tokens, Cost, and Latency. Non-success rows carry a red "blocked" or amber "failed" badge. Export CSV downloads everything matching the current filters.
The "Why this routing" drawer
Click any row to open a drawer with:
- A plain-English explanation of the routing decision, built from the request's own routing record.
- A request-flow strip: App → Classify → Route → (Cache) → Model → Provider.
- Status, latency, and cost tiles, token counts, and any error message.
- The request payload and the response, when payload capture is on (otherwise "not captured").
Recommendations
Costed suggestions to move a task off a premium model, measured from your own traffic. The system proposes; a human decides. Click Recompute to re-analyse the logged data.
Each pending recommendation shows the current → suggested model, a projected saving, and a three-step tracker: Build dataset → Run eval → Start canary. Accepting is gated on evidence: if the recommendation hasn't passed an eval, you're asked for an override reason before it goes through. Accepting creates a routing rule that starts disabled, so nothing changes until you switch it on. This flow runs on the same machinery as Model evals.
When there's nothing to act on, the page says so. If high-spend task types simply aren't marked as "cheap" yet, it surfaces the hidden savings and offers a one-click "Mark cheap & recompute".
Arbr overhead
Reached from the Overview "Arbr overhead" tile. Arbr makes some LLM calls for itself: classifying tasks, generating routing policies, judging evals, and testing connections. That's real money on your provider keys, so it's counted in your total spend but kept out of the per-application views. This page breaks it down by kind and by model, which is where an unexpectedly expensive internal call shows up. To cut the biggest piece, pin taskType on your requests so the gateway can skip the classifier call.
Now that you can read the console, the other three guides show how to act in it: set up routing, run model evals, and configure governance and budgets.